

Preview
Dig into the numbers behind these figures in the Electric Homes & Vehicles Report 2026 — read the full national report →

Electrifying {{location}}

A pathway to savings for households, economic growth for the community, reduced emissions and greater resilience.

{{location}} has crossed the electrification tipping point where homes can save money and reduce their emissions by going electric.

The technology is proven, the economics stack up, and the transition is already underway. But there are still plenty of households paying more than they need to by running on fossil fuels.

The opportunity for {{location}}

{{elec_savings_annual}}
bill savings every year by electrifying {{location}} households and vehicles*
{{bills_net_savings}}
net savings per household, every year, including upfront costs
{{bill_savings}}
energy bill savings per household, every year
{{machines_total}}
fossil fuel machines (cars, heaters and cooktops) in {{location}} homes
{{co2e_annual}} tonnes
CO₂e avoided every year
{{jobs_created}}
new local jobs created

*Community savings assume upgrading home appliances to electric and adding solar and batteries to 80% of homes. Net savings include upfront costs and interest.

{{location}} homes could cumulatively save a net {{cumulative_savings}} between 2026 and 2040

As more homes electrify, the savings add up. By 2040, {{location}} households could collectively save {{cumulative_bills}} on energy bills, or {{cumulative_savings}} net including upfront costs. And the earlier homes make the switch, the more savings they'll see.

Cumulative savings graph — awaiting the year-by-year data
Explore by benefit
Explore by machine
Illustration of New Zealand cash and coins with a rising savings arrow

Economics

{{elec_savings_annual}} saved
every year

Electrifying home appliances and vehicles, with 80% adopting rooftop solar and batteries, would cut {{location}} household energy costs by {{elec_savings_annual}} every year. That's {{elec_savings_daily}} saved every day, and meaningful cost of living relief for {{location}} households.

{{fossil_spend_annual}} spent
on fossil fuels every year

That's {{fossil_spend_daily}} every day on fossil fuels by just households in {{location}}. Most of these fossil fuels are imported, meaning this money leaves the local economy. Plus, history shows fossil fuel costs are volatile, with prices rising faster than the rate of inflation.

Illustration of an electrician's tools

Emissions and jobs

{{co2e_annual}} tonnes CO₂e
avoided every year

Electrifying {{location}}'s homes will result in a significant reduction in emissions. That's the equivalent of {{equiv_flights}} one-way flights per passenger from Auckland to Queenstown.

{{jobs_created}} local jobs
created in {{location}}

New local jobs, driven by additional installation labour and the savings flowing through the community.

Illustration of a power bill with a falling-cost arrow

Bills

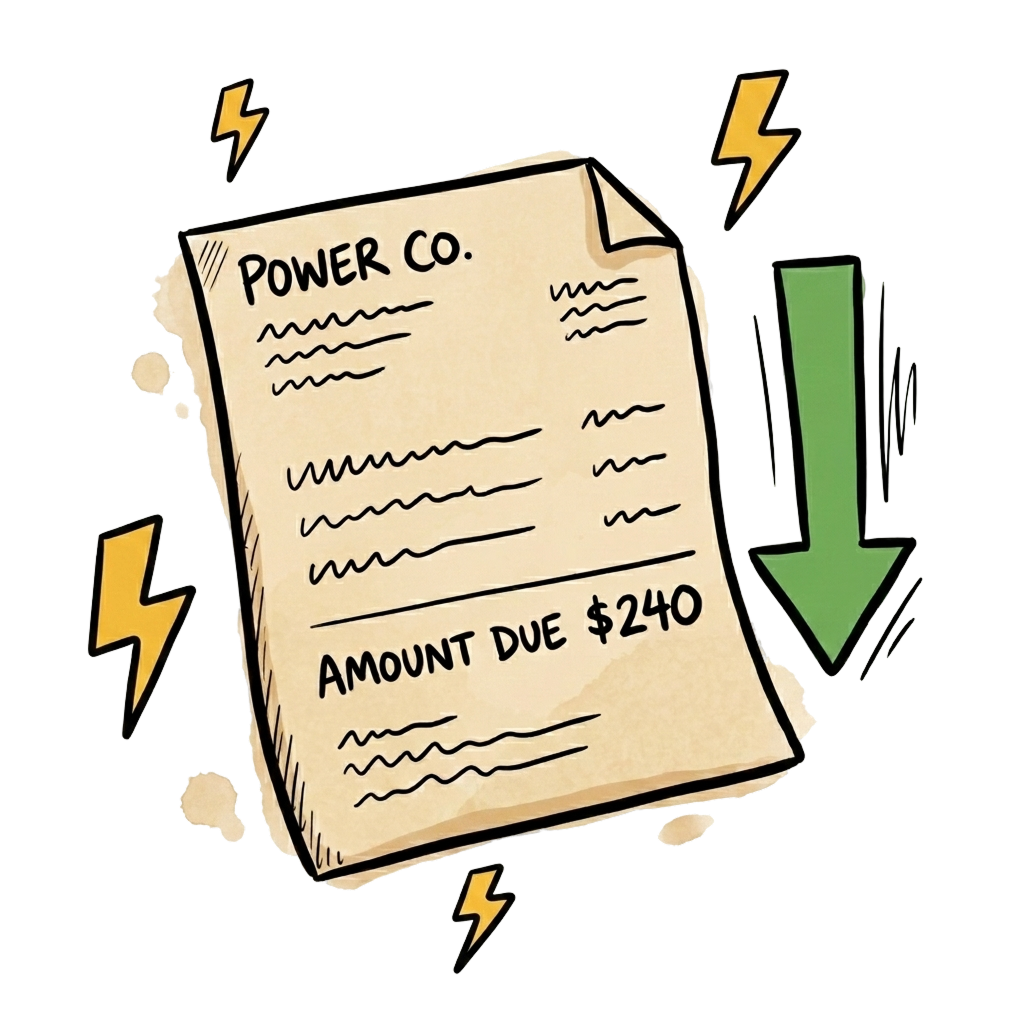
In a fossil fuel home, energy spending is spread across multiple fuels, each with its own bill, its own price fluctuations, and its own supplier. When a {{location}} home electrifies (using electric heating and cooking, driving two EVs, plus solar and batteries), they consolidate their energy into a single source — electricity — meaning lower bills and far greater control.

{{bill_savings}}
a year lost by a fossil fuel home in {{location}}
{{bills_net_savings}}
net better off every year, even with upfront costs

An average {{location}} home using gas appliances and petrol vehicles is missing out on around {{bill_savings}} in savings on its energy bills every year compared to a home with electrified appliances and vehicles plus a solar and battery system. Excludes upfront costs. Based on 2026 energy prices.

With upfront costs and loan repayments included, an all-electric {{location}} home is still {{bills_net_savings}} net better off per year, and a net {{bills_net_15yr}} better off over 15 years. Includes upfront costs and interest at 5.5% p.a. Based on 15 year average forward energy prices annualised and in 2026 dollars.

Annual savings
Source: Compare Homes!B7:E22 — the model's per-location home comparison. Tab 1 = bills only (savings row E19); Tab 2 = including annualised upfront costs & interest (savings row E18). Headline household savings figure: C46. If this location is missing model chart data, national placeholder figures are shown instead.
Illustration of a speech bubble with a house and heart

Local stories

Illustration of a solar panel and home battery

Solar and batteries

{{solar_box1_num}} savings
{{solar_box1_meta}}
{{battery_life}} years
expected battery lifetime, ~10 year warranty
{{solar_panel_life}} years
panel lifetime and warranty

Solar offers strong payback for {{location}} homes, even in shaded areas, while improving energy independence.

With solar, the household is paying an effective electricity price of {{solar_effective_rate}} (financed at {{solar_finance_rate}}), compared to the grid rate of {{grid_rate}} (excludes fixed cost).

Solar panels are expected to last {{solar_panel_life}} years, with warranties of a similar length, meaning the system well outlasts any loan used to finance it. Plus a battery locks in lower energy costs into the future and increases household resilience, keeping essential appliances running during outages.

Illustration of an electric car on charge

Electric vehicle

{{ev_net_savings}} savings
net over 15 years from a petrol to electric medium SUV
{{cars_fossil}}
petrol and diesel cars in {{location}}

Households in {{location}} currently spend {{pump_spend_daily}} at the pump every day. Yet EVs are far cheaper to run, require little maintenance and aren't exposed to volatile global fuel prices. Plus they're quiet, comfortable and fun to drive!

{{location}} drivers cover an average of {{driving_weekly_km}} per week: well within the range of a modern EV. Switching from a petrol to an electric medium SUV saves around {{ev_annual_savings}} every year, including road user charges. Diesel ute drivers save even more at {{ev_ute_savings}} net over 15 years, or {{ev_ute_annual_savings}} every year. Those who need to drive more will save more from switching to electric.

And charging is easy. 80% of EV owners do more than half their charging at home1. 60% trickle charge using a standard three-pin plug2. Charging at home using grid electricity costs effectively half what you'd spend on petrol or diesel, and for those with rooftop solar, the savings are even greater. For when you do need to charge on the go, public chargers are available at least every 75km on 97% of New Zealand highways3.

EVs also eliminate tailpipe emissions. Vehicle air pollution costs New Zealand an estimated $10.5 billion every year in health and productivity costs, plus 2,200+ premature deaths and 9,000+ hospitalisations every year4.

Source: Machines!C331:U346 — per-location vehicle lifetime costs incl. purchase price, yearly bills, and emissions {M:AB331:AC346} (fuel prices & distances from Compare cars!B7:C24). If this location is missing model chart data, national placeholder figures are shown instead.
Illustration of a wall-mounted heat pump

Heat pump

{{heatpump_lifetime_savings}} savings
over 15 year lifetime including upfront costs, compared to {{heatpump_switch_short}}
{{heaters_fossil}}
{{heater_count_label}}

Heat pumps use around {{heatpump_energy_pct}} less energy than gas heaters to deliver the same warmth, and, unlike gas, they cool in summer too. Heat pumps also tend to have lower upfront costs compared to their fossil fuel equivalents.

Switching from {{heatpump_switch_from}} to a heat pump saves {{heatpump_15yr_savings}} on bills over 15 years (around {{heatpump_annual_savings}} every year) and {{heatpump_lifetime_savings}} over the lifetime including upfront costs. {{heater_breakdown}}

Whatever the fuel type, going electric brings significant savings, and the comfort upgrade is immediate.

Source: Machines!C36:G40 (15-year lifetime), Machines!B11:H19 (yearly bills) and {M:AA11:AB19} (yearly emissions) — per-location heating needs, prices and emissions. If this location is missing model chart data, national placeholder figures are shown instead.
Illustration of a hot water heat pump cylinder

Hot water heat pump

{{water_lifetime_savings}} savings
over 15 year lifetime including upfront costs, compared to {{water_switch_short}}
{{water_heaters_fossil}}
{{water_count_label}}

Hot water heat pumps have a higher upfront cost, but deliver the lowest ongoing energy bills of any water heating option. In {{location}}, switching from {{water_switch_from}} to a hot water heat pump saves {{water_15yr_savings}} on bills over 15 years, or {{water_lifetime_savings}} including upfront costs. {{water_breakdown}}

Water heating makes up around {{water_energy_pct}} of an average home's energy load, making it one of the highest-impact switches a household can make. Hot water heat pumps can also act as a 'thermal battery' where you time it to heat water when electricity is cheapest, or when your solar panels are generating.

Source: Machines!C78:G84 (15-year lifetime), Machines!M76:O84 (yearly bills) and {M:AA78:AB84} (yearly emissions) — per-location. If this location is missing model chart data, national placeholder figures are shown instead.
Illustration of an induction cooktop with a pot

Induction cooktop

{{cooktop_savings}} savings
bill savings over 15 years, LPG to induction
{{cooktop_gas_stat}}
{{cooktops_gas}}
{{cooktop_count_label}}

Cooking doesn't use a lot of energy but electric cooking is lower cost (and much lower emissions) than cooking with gas. Induction is more expensive upfront than resistive electric cooking, but offers lower ongoing bills. {{cooktop_breakdown}}

But the most compelling case for electric might be health. Gas cooking releases nitrogen dioxide and other pollutants into the home, linked nationally to 200+ premature deaths, 3,200+ child asthma cases, and $3.3 billion in health and productivity costs every year4. That's $9,100 per stovetop in New Zealand5.

Source: Machines!B105:I108 — per-location cooking costs (15-year lifetime and yearly); yearly emissions {M:AA105:AB108}. If this location is missing model chart data, national placeholder figures are shown instead.
Sources
  1. Consumer NZ, New Zealand electric car myths debunked, 2025
  2. Powerswitch, The best power plans for charging your EV
  3. Ministry of Transport, Charging Our Future: National electric vehicle charging strategy for Aotearoa New Zealand 2023–2035, 2023
  4. Ministry for the Environment, Our Air 2024, 2024
  5. EECA, Indoor combustion in New Zealand homes: health effects and costs, 2025
Illustration of a cluster of houses sharing a lightning bolt

Electric community

Community banner image (CMS: Custom Background image)

Electrify {{location}}

Group subtitle — a brief description of the local electrification community group, pulled from the community page in the CMS.

Visit the {{location}} community page

Take the {{location}} report with you

Download a shareable PDF of the full {{location}} electrification report — perfect for council meetings, community groups, or sharing with your neighbours.

Download {{location}} report (PDF)

Read the full national report

Unless otherwise stated, data in this report is drawn from Rewiring Aotearoa's independent, peer reviewed modelling. Dig into the numbers behind these figures in the Electric Homes & Vehicles Report 2026 — Rewiring Aotearoa's full analysis of the opportunity of going electric across New Zealand.

Electric Homes & Vehicles Report